To properly assess the performance of your cells in 3D culture, it’s necessary to run a viability test. The most common one is the Live/Dead assay – a cell staining procedure in which cytoplasm in live cells fluoresce green with calcein AM and dead cells fluoresce red when ethidium homodimer (EthD) binds to their DNA. Read on for our step-by-step guide on how to perform a Live/Dead quantification using Imaris.
If you have a relatively thin 3D sample or 2D cell culture, you can quantify Live/Dead assay microscopy images by simple Fiji (ImageJ) analysis. However, if you are analyzing a thicker 3D hydrogel with cells embedded inside, some more advanced analysis might be necessary. We recommend using Imaris, a popular microscopy image analysis software for live/dead quantification.
To follow our tutorial on live/dead quantification using Imaris, you can download an example confocal microscopy picture of live/dead staining of cancer cells.
Note: Certain molecules from the extracellular matrix are auto-fluorescent. For instance, collagen will give a green fluorescence which can hinder the image quality and background. Check your sample for interference of the used exciting wavelength with your hydrogel support.
File opening
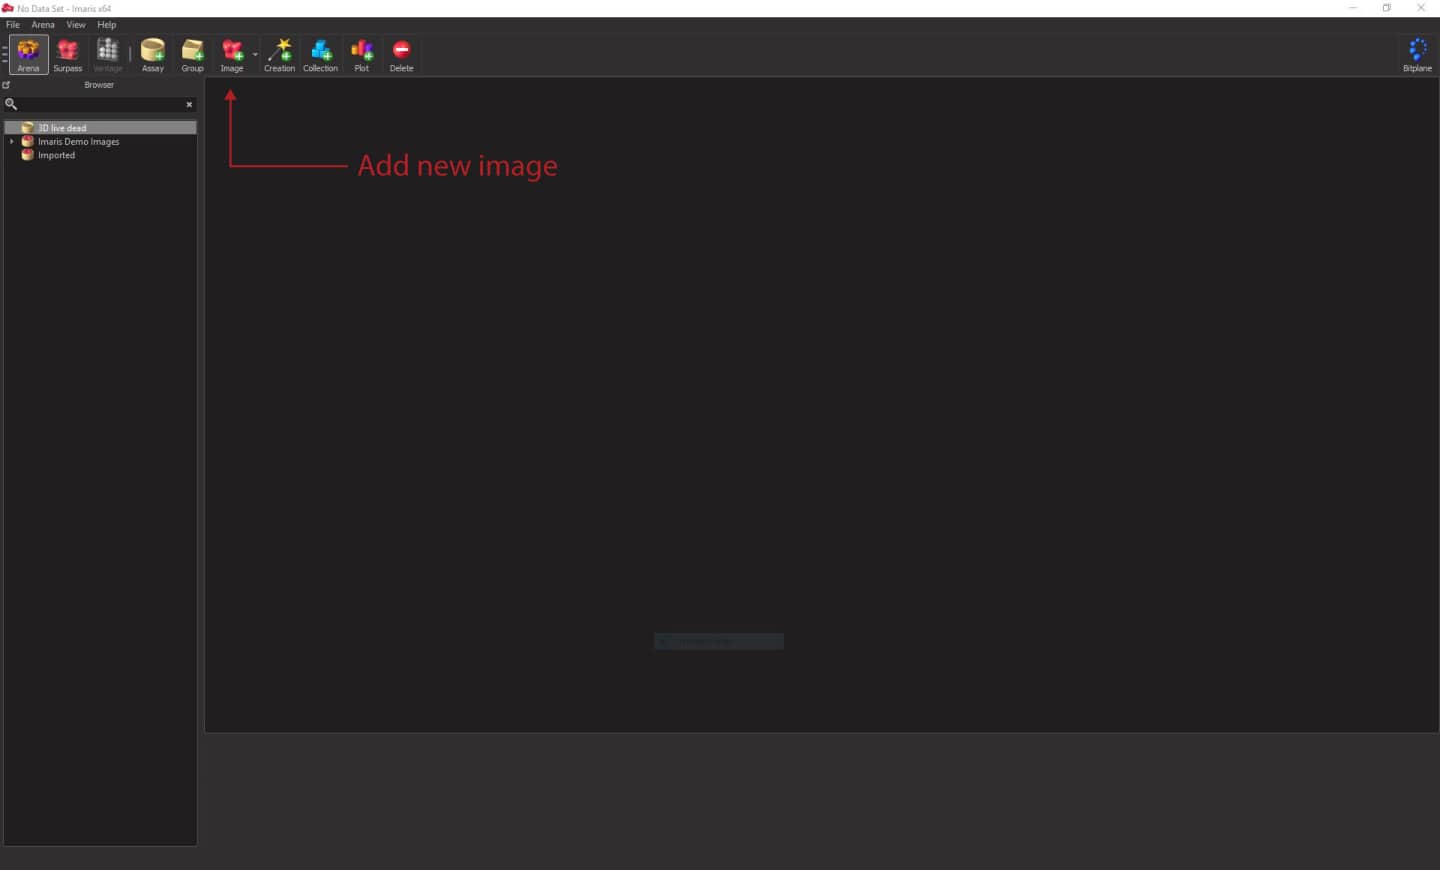
Click on the Image button on the top menu and select your .lsm file. It will be imported to a selected folder in Arena view (you can select it in the top menu). Double click on the file preview and open the image.
Display adjustment
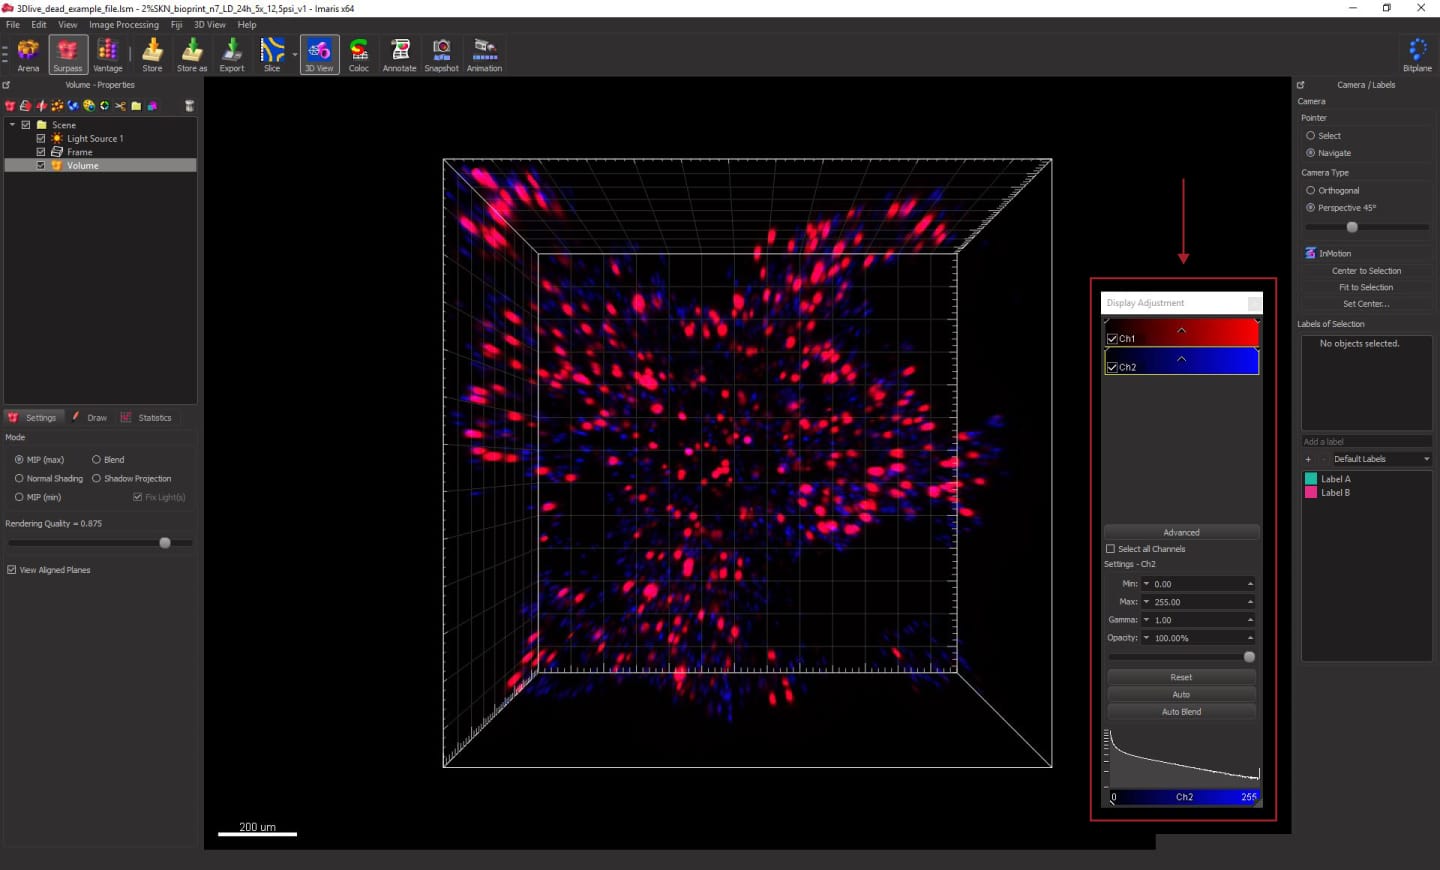
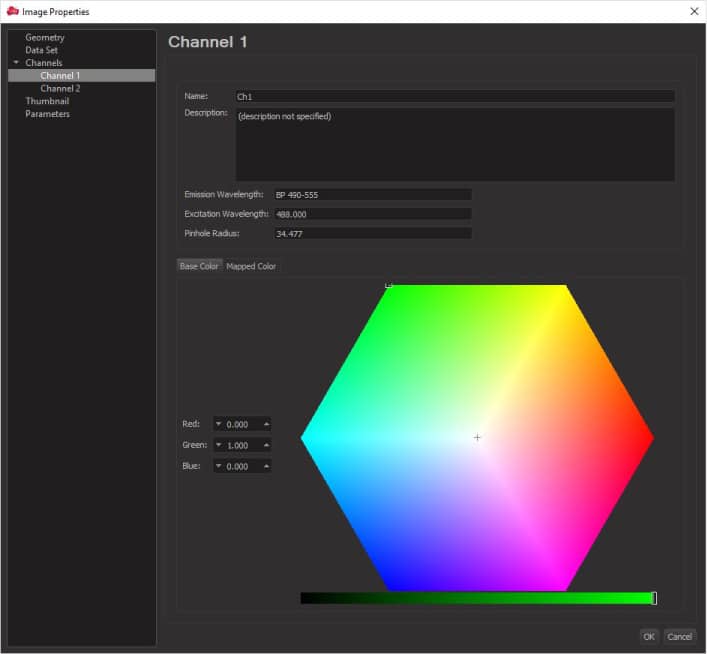
If the colors are not displayed properly, you can change them in Display adjustment. You can open the Display adjustment menu by going to Edit -> Show Display Adjustment. In the window that opens, click Channel Names and assign new colors: green for live cells (Ch1) and red for dead cells (Ch2). You can also drag the arrows on the channel spectrum to change the intensity of the colors displayed.
Navigation
To navigate, choose Navigate in the Camera/Labels panel on the left. Then, simply click and drag on the image to rotate. Use the mouse scroll to zoom in and out. Right-click to pan. To change between Navigate and Select option, you can press the Escape button on the keyboard.
Count the number of objects
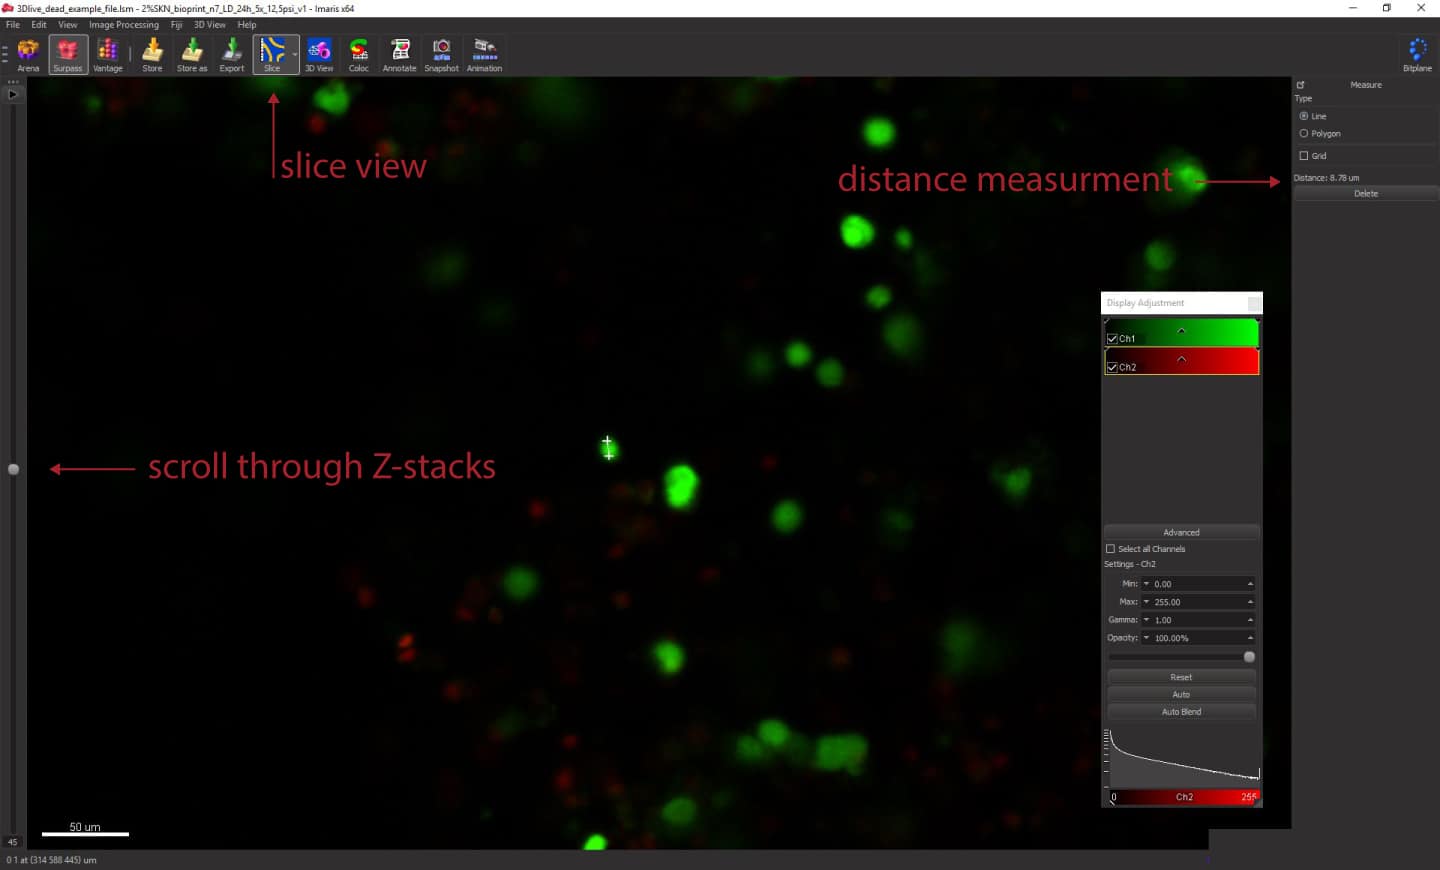
First, we will need to determine the smallest diameter of the objects we want to calculate. To do that, select Slice view from the top menu. You can use the slider on the left to scroll through the z-stacks. In this view, you can also zoom in and out using the mouse scroll. Zoom in at some small live cells and left-click on one edge of it and then click the second time across the cytoplasm to measure the distance. The measured value will appear on the right panel, under Distance. You can repeat that process on several different cells. Note the diameter for later use. In our case, small live cells are around 8-9um.
Depending on your acquisition settings, you might encounter z-axis elongation of the cells. Thus the cells won’t appear as spherical. We should now measure their length in the z-axis. To do that, scroll through z-stacks using the slider on the left. Find an example cell and look where it starts to appear in a particular location. Click in the middle of that cell, then scroll to find the other edge of the same cell across z-stacks. Note the value displayed on the right panel. The length of the live cells in the example image is around 140 um.
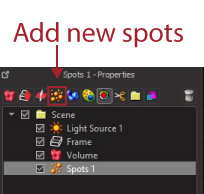
Add new spots
From the panel on the left: Volume – Properties, click the ‘Add new spots’ button. You will see a new window appear below, called Algorithm. Here, we adjust the spot detection parameters in 3 steps.
In the first step, you can choose to segment only a part or the whole image. Partial images might be useful if you are working with much bigger files. For now, we will leave ‘Segment only a Region of Interest’ checkbox unchecked. Also, we will assume that our spot sizes are relatively similar and won’t use Different Spot Sizes option. Click on the blue arrow at the bottom to continue to the next step.
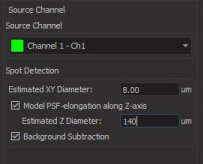
The next step is to choose the Source Channel. First, we will select green Channel 1 for live cells.
In the next section, ‘Spot Detection’, enter live-cell diameter measured in the previous step. For our case, we will enter 8 um. Also check Model PSF-elongation along Z-axis box, to account for cell elongation on the image. As Estimated Z Diameter, enter cell length measured in the previous step. For us, it’s 140 um.
You can also select Background Subtraction to clean up your image a little bit. When you’re done, click on the blue arrow at the bottom.
In the next step, we will adjust how many spots are detected based on the signal quality. The quality filter should be selected by default in the Filters section in this step. You can also add additional filters if you want.
At the bottom part of the panel, you can see a quality histogram. Adjust the selection by dragging and dropping the ends of the yellow selection box, to filter out spots that you don’t want to include in your analysis. You can zoom into your image and observe where the software puts cylindrical-shaped objects. These will be the objects counted in the analysis. If you think that the default value is missing a lot of spots, drag the left end of the yellow selection box and move it to the left. Do the opposite if you want to decrease the number of selected spots.
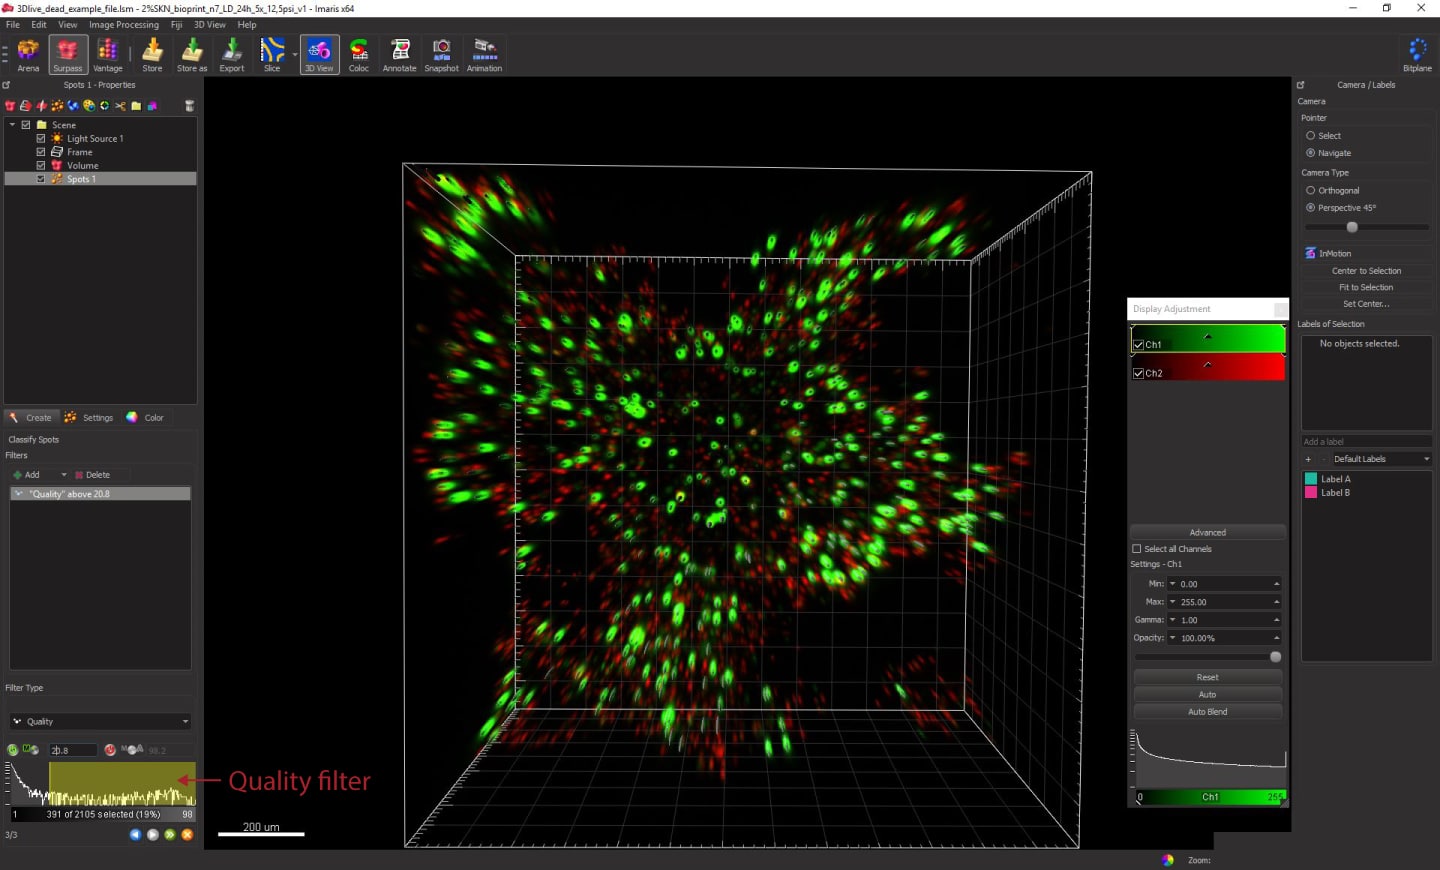
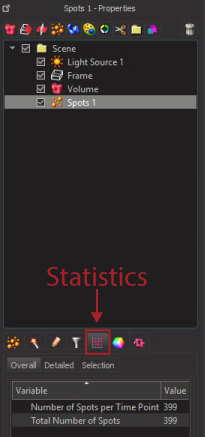
When you are satisfied with the selection, click on the green arrow at the bottom. The software will generate 3D spots that can be viewed in the Properties panel at the top left. To find out how many spots you created, highlight the spots and choose a line chart button Statistics to see more details. Total Number of Spots will be displayed. In the Detailed tab, you can also see more advanced statistics. Write this number down or export the statistics by clicking a save button at the bottom of the panel.
Repeat the same process for the dead cells in Channel 2.
Our analysis showed 399 live cells and 1359 dead cells, giving a final result of 0.22% viable cells.
We hope this tutorial on how to perform a Live/Dead quantification Using Imaris was helpful! Click here to read more bioprinting tip and tricks on the Allevi support page.
