- About Allevi
- Bioprinters
- BioinksAdditivesAdditivesBioinksAdditivesAdditivesAdditivesAdditivesAdditivesAdditives
- Software
- Services
- Resources
- Support
Menu
Percoll is a well-referenced media for density gradient centrifugation of cells, viruses and subcellular particles(1). Percoll is composed of colloidal silica coated with polyvinylpyrrolidone (PVP). Percoll has also been previously used to improve cell distribution when bioprinting with low viscosity matrix bioinks(2). Below, Percoll is tested with two Allevi reagents, PEGDA and fibrinogen.
To minimize cell settling during bioprinting, Percoll was added to PEGDA/LAP solutions(3). A gradient ranging from 10 – 90% Percoll prepared with 20% PEGDA solutions was created in a 15 ml centrifuge tube (3 layers of 1 ml each) (3). A suspension of HNDFs (1 ml of 1 x 10⁶ cells) was pipetted on top of the gradient, then the tubes were centrifuged at 200 x g for 5 min. After, cell number in each fraction was analyzed through brightfield imaging (3).Next, a 24-hour bioprint study was completed with each concentration of Percoll. Cell counts were taken from LIVE/DEAD fluorescent images of bioprinted thin films of each solution. Again, 40 and 90% Percoll solutions mixed with 20% PEGDA produced cell counts not statistically different from each other. However, 90% Percoll solutions had a greater standard deviation than 40% Percoll solutions. Therefore 40% Percoll and 20% PEGDA solutions were used for all future studies.
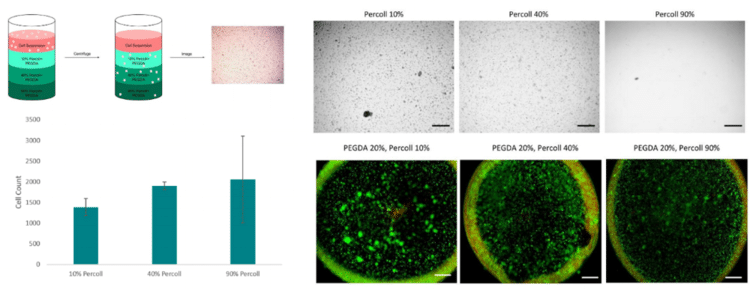
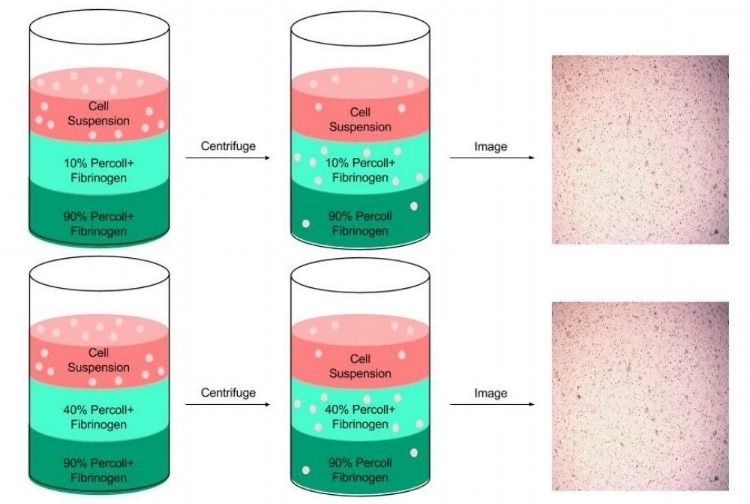
To minimize cell settling during bioprinting, Percoll was added to 35 mg/ml fibrinogen solutions(3). A gradient ranging from 10 – 90% Percoll prepared with 20% PEGDA solutions was created in a 15 ml centrifuge tube (3 layers of 1 ml each), similar to PEGDA/Percoll solutions in Figure 1 (3). A suspension of HNDFs (1 ml of 1 x 10⁶ cells) was pipetted on top of the gradient, then the tubes were centrifuged at 200 x g for 5 min. After, cell number in each fraction was analyzed through brightfield imaging (3). With high cell concentrations in both 10% and 40% Percoll solutions, a second centrifugation test analyzing each gradient in a separate centrifuge tube (Figure 6). Results from this test demonstrated a larger standard deviation in 10% Percoll solutions, so a 40% percoll solution was chosen for future studies.
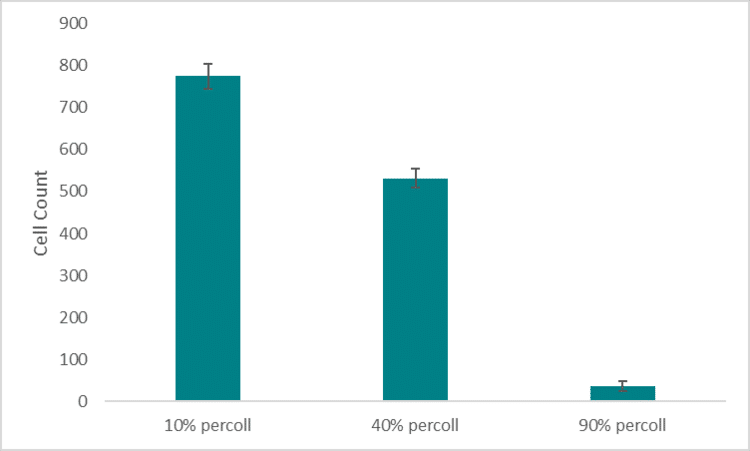
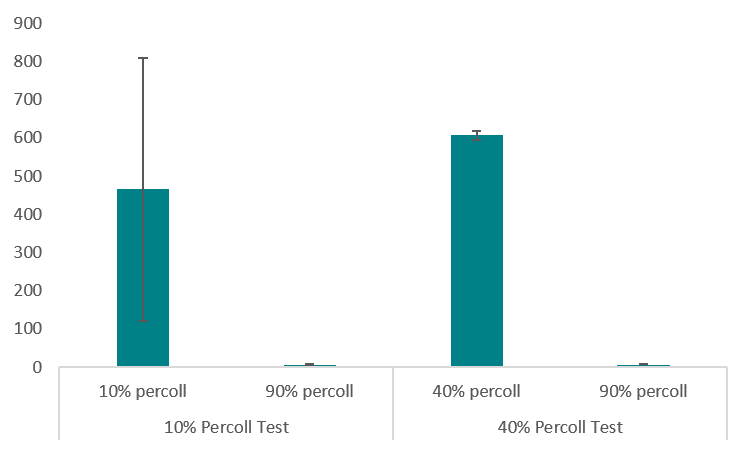
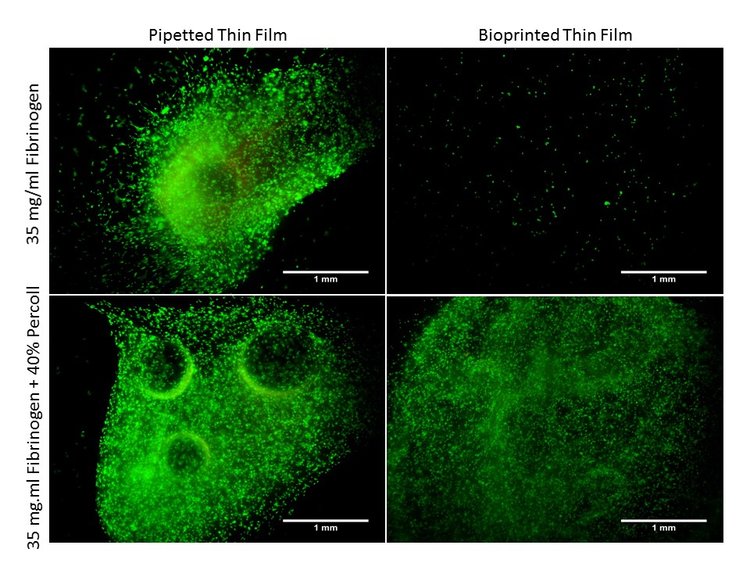
Next, a 24-hour bioprint study was completed with each concentration of Percoll. Cell counts were taken from LIVE/DEAD fluorescent images of bioprinted thin films of each solution. Again, 40 and 90% Percoll solutions mixed with 20% PEGDA produced cell counts not statistically different from each other. However, 90% Percoll solutions had a greater standard deviation than 40% Percoll solutions. Therefore 40% Percoll and 20% PEGDA solutions were used for all future studies. A 24-hour viability study was completed on bioprinted films with fibrinogen and Percoll (Figure 6). This study analyzed the Percoll improves cell distribution
Primary Human Neonatal Dermal Fibroblasts (HNDFs) obtained from ATCC were cultured in monolayer cultures at 37 °C and 5% of CO2 using Dulbecco’s Modified Eagle Medium (Corning) supplemented with 10% fetal bovine serum (Hyclone) and 1% penicillin-streptomycin-amphotericin (Corning). Passage numbers under 12 were used.
To minimize cell settling during bioprinting, Percoll (Sigma-Aldrich) was added to PEGDA/LAP solutions(3). A gradient ranging from 10 – 90% Percoll prepared with 20% PEGDA solutions was created in a 15 ml centrifuge tube (3 layers of 1 ml each) (3). A suspension of HNDFs (1 ml of 1 x 10⁶ cells) was pipetted on top of the gradient, then the tubes were centrifuged at 200 x g for 5 min. After, cell number in each fraction was analyzed through brightfield imaging (3).
To create PEGDA bioink, LAP was dissolved in cell culture media under stirring and heat (60˚C). Next PEGDA, purchased from Allevi, was mixed in each solution. After the mixture was completely dissolved and homogeneous, it was sterile filtered (0.45 μm) (Millipore) as suggested in the protocol provided by Allevi. Once solutions were filtered, each was heated to 37°C and mixed with Percoll for final concentrations of 20% (w/v) PEGDA, 0.5% (w/v) LAP and either 10, 40 or 90% (v/v) Percoll. After mixing with Percoll, HNDFs were added at a 5 million/ml concentration.
To create fibrinogen bioink, fibrinogen was carefully dissolved in cell culture media without calcium or magnesium at 37˚C. The solution was carefully handled to avoid any shaking or agitation. After the mixture was completely dissolved and homogeneous, it was sterile filtered (0.45 μm) (Millipore) as suggested in the protocol provided by Allevi. Once solutions were filtered, each was heated to 37°C and mixed with Percoll for final concentrations of 20 mg/ml fibrinogen and either 10,40 or 90% (v/v) Percoll. After mixing with Percoll, HNDFs were added at a 5 million/ml concentration.
To fabricate PEGDA thin films, Glass coverslips were first treated as suggested in the protocol provided by Allevi. This mixture was then pipetted onto treated glass at 10 μl. Next, the PEGDA solutions were exposed to blue light (405 nm) at 10 mW/cm² for 4 minutes. The thin films, stuck on the glass, were then placed into 24 well plates (Corning). For bioprinting studies, G-code files for developed to extrude material for 3 seconds. Pressures of 3.4-4.8 psi were used to print PEGDA solutions, along with tapered metal 150 µm diameter needles. Thin films were printed onto treated glass slides, then crosslinked for 4 min with blue light (405 nm) at 10 mW/cm². All samples were bioprinted with an Allevi 2.
To fabricated fibrin thin films, fibrinogen solutions were pipetted or bioprinted into well plates at 10 μl volumes. Samples were then mixed with 100 /ml Thrombin, 2mM CaCl2, and 0.1% (wt) transglutaminase to crosslink. For bioprinting studies, G-code files for developed to extrude material for 0.7 seconds. Pressures of 4 -5 psi were used to print fibrinogen solutions, along with 30 gauge 0.25″ length needles. Thin films were printed into 24 well plates then crosslinked with thrombin, CaCl2, and transglutaminase.
To assess cell viability, A LIVE/DEAD kit (Life Technologies) was used. Images were taken on a Nikon TE300 Inverted Fluorescent Microscope or a Leica TCS SP5 II Scanning Laser Confocal Microscope. All images were analyzed with ImageJ.